
|
|
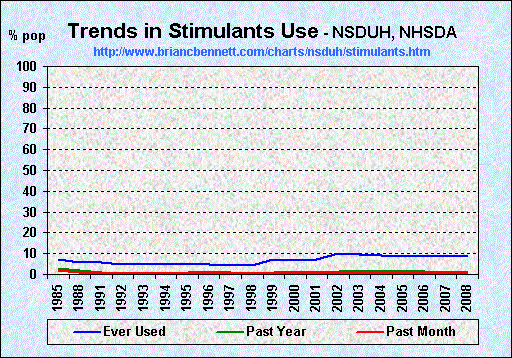
| Nonmedical Use of Stimulants Among Those 12 and Older -- by Number of Users (1985 - 2008) | |||
|---|---|---|---|
| Year | Ever Used | Past Year | Past Month |
| 1985 | 14,139,000 | 5,637,000 | 3,407,000 |
| 1988 | 11,241,000 | 3,698,000 | 2,383,000 |
| 1991 | 11,385,000 | 2,010,000 | 906,000 |
| 1992 | 10,284,000 | 1,478,000 | 688,000 |
| 1993 | 10,007,000 | 1,774,000 | 976,000 |
| 1994 | 9,671,000 | 1,419,000 | 678,000 |
| 1995 | 10,360,000 | 1,656,000 | 798,000 |
| 1996 | 10,075,000 | 1,896,000 | 763,000 |
| 1997 | 9,781,000 | 1,687,000 | 612,000 |
| 1998 | 9,614,000 | 1,489,000 | 633,000 |
| 1999 | 15,922,000 | 2,291,000 | 950,000 |
| 2000 | 14,661,000 | 2,112,000 | 788,000 |
| 2001 | 16,007,000 | 2,486,000 | 1,018,000 |
| 2002 | 23,496,000 | 3,380,000 | 1,303,000 |
| 2003 | 23,004,000 | 3,031,000 | 1,310,000 |
| 2004 | 22,297,000 | 3,254,000 | 1,312,000 |
| 2005 | 20,983,000 | 3,088,000 | 1,188,000 |
| 2006 | 22,468,000 | 3,791,000 | 1,385,000 |
| 2007 | 21,654,000 | 2,998,000 | 1,053,000 |
| 2008 | 21,206,000 | 2,639,000 | 904,000 |
| truth: the Anti-drugwar | ||
| Homepage | Sitemap | |