|

|
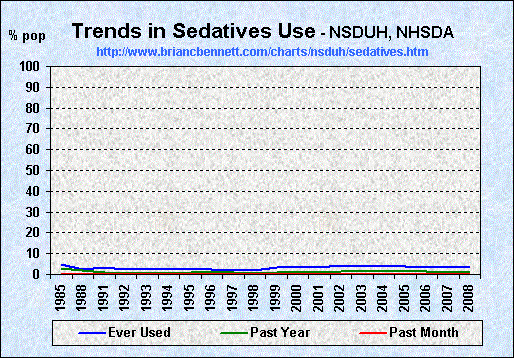
| Nonmedical Use of Sedatives Among Those 12 and Older - by Number of Users (1985 - 2008) | |||
|---|---|---|---|
| Year | Ever Used | Past Year | Past Month |
| 1985 | 9,260,000 | 2,209,000 | 964,000 |
| 1988 | 5,206,000 | 1,376,000 | 468,000 |
| 1991 | 6,482,000 | 946,000 | 468,000 |
| 1992 | 5,309,000 | 802,000 | 430,000 |
| 1993 | 5,320,000 | 702,000 | 315,000 |
| 1994 | 5,460,000 | 736,000 | 222,000 |
| 1995 | 5,760,000 | 666,000 | 421,000 |
| 1996 | 4,866,000 | 678,000 | 232,000 |
| 1997 | 4,080,000 | 638,000 | 187,000 |
| 1998 | 4,640,000 | 522,000 | 210,000 |
| 1999 | 7,747,000 | 631,000 | 229,000 |
| 2000 | 7,142,000 | 611,000 | 175,000 |
| 2001 | 7,477,000 | 806,000 | 306,000 |
| 2002 | 9,960,000 | 981,000 | 436,000 |
| 2003 | 9,510,000 | 831,000 | 294,000 |
| 2004 | 9,891,000 | 737,000 | 265,000 |
| 2005 | 8,982,000 | 750,000 | 272,000 |
| 2006 | 8,822,000 | 926,000 | 385,000 |
| 2007 | 8,396,000 | 864,000 | 346,000 |
| 2008 | 8,882,000 | 621,000 | 234,000 |
| truth: the Anti-drugwar | ||
| Homepage | Sitemap | |