|
|
Source: Monitoring the Future, Vol I (2009), Table 5-2, pp.194-7
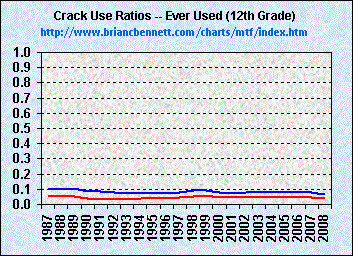
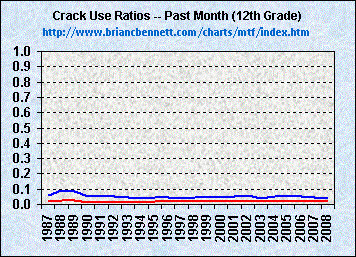
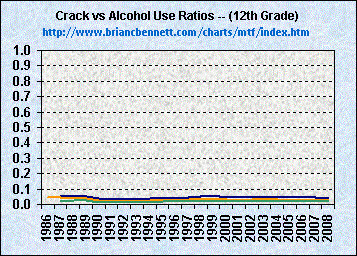
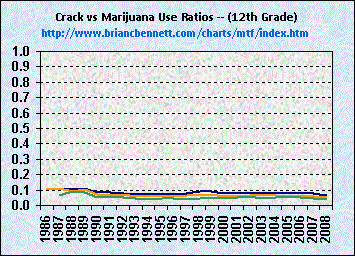
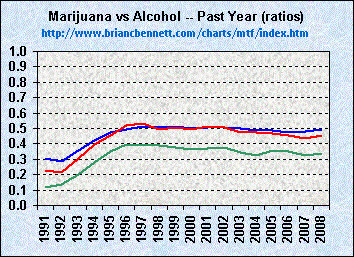
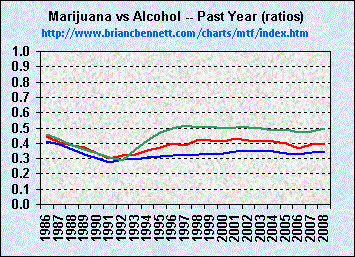
| Ratios of Crack Use vs Alcohol and Marijuana Use Among 12th Grade Students -- Past Year Use | ||
|---|---|---|
| Year | vs Alcohol | vs Marijuana |
| 1986 | 0.05 | 0.11 |
| 1987 | 0.05 | 0.11 |
| 1988 | 0.04 | 0.09 |
| 1989 | 0.04 | 0.10 |
| 1990 | 0.02 | 0.07 |
| 1991 | 0.02 | 0.06 |
| 1992 | 0.02 | 0.07 |
| 1993 | 0.02 | 0.06 |
| 1994 | 0.03 | 0.06 |
| 1995 | 0.03 | 0.06 |
| 1996 | 0.03 | 0.06 |
| 1997 | 0.03 | 0.06 |
| 1998 | 0.03 | 0.07 |
| 1999 | 0.04 | 0.07 |
| 2000 | 0.03 | 0.06 |
| 2001 | 0.03 | 0.06 |
| 2002 | 0.03 | 0.06 |
| 2003 | 0.03 | 0.06 |
| 2004 | 0.03 | 0.07 |
| 2005 | 0.03 | 0.06 |
| 2006 | 0.03 | 0.07 |
| 2007 | 0.03 | 0.06 |
| 2008 | 0.02 | 0.05 |
| Average | 0.03 | 0.07 |
Other Available Trend Comparisons
Click graphics to navigate
| Lifetime Use Comparison | Past Month Use Comparison | Drug Use Trends vs Alcohol |
 |
 |
 |
| Drug Use Trends vs Marijuana | College Crack Use Comparison | 19 to 28 Year Olds Crack Use Comparison |
 |
 |
 |
| Overview of 12th Grade Drug Use | Comparison Trends Across HS Students | Comparison Trends Across Young Adults |
 |
 |
 |