|
|
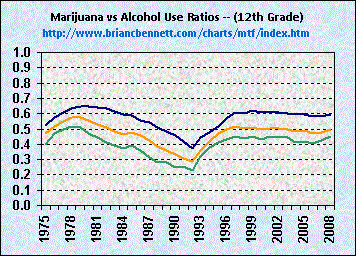
Source: Monitoring the Future, Vol I (2009), Tables 5-1, 5-2, and 5-3, pp.191-199
| Ratios of Crack Use vs Alcohol Use Among 12th Grade Students (1986 - 2008) | |||
|---|---|---|---|
| Year | Lifetime | Past Year | Past Month |
| 1986 | 0.00 | 0.05 | 0.00 |
| 1987 | 0.06 | 0.05 | 0.02 |
| 1988 | 0.05 | 0.04 | 0.03 |
| 1989 | 0.05 | 0.04 | 0.02 |
| 1990 | 0.04 | 0.02 | 0.01 |
| 1991 | 0.04 | 0.02 | 0.01 |
| 1992 | 0.03 | 0.02 | 0.01 |
| 1993 | 0.03 | 0.02 | 0.01 |
| 1994 | 0.04 | 0.03 | 0.02 |
| 1995 | 0.04 | 0.03 | 0.02 |
| 1996 | 0.04 | 0.03 | 0.02 |
| 1997 | 0.05 | 0.03 | 0.02 |
| 1998 | 0.05 | 0.03 | 0.02 |
| 1999 | 0.06 | 0.04 | 0.02 |
| 2000 | 0.05 | 0.03 | 0.02 |
| 2001 | 0.05 | 0.03 | 0.02 |
| 2002 | 0.05 | 0.03 | 0.02 |
| 2003 | 0.05 | 0.03 | 0.02 |
| 2004 | 0.05 | 0.03 | 0.02 |
| 2005 | 0.05 | 0.03 | 0.02 |
| 2006 | 0.05 | 0.03 | 0.02 |
| 2007 | 0.04 | 0.03 | 0.02 |
| 2008 | 0.04 | 0.02 | 0.02 |
| Average | 0.04 | 0.03 | 0.02 |
Other Available Trend and Comparison Data
Click graphics to navigate