Monitoring the Future -- Hallucinogen Use
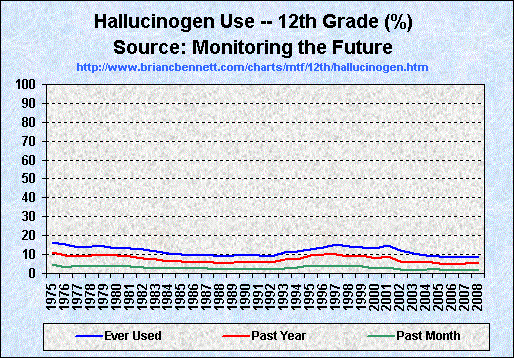
Trends Among 12th Grade Students (1975 - 2008)
 |
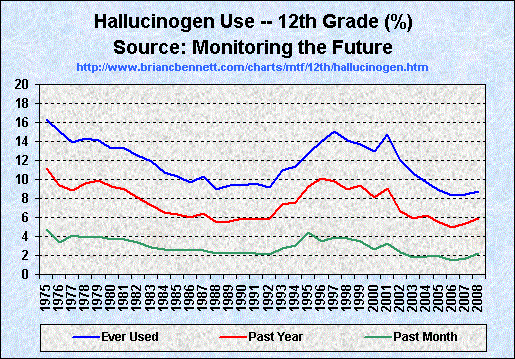 |
Source: Monitoring the Future (2009), Vol I, Tables 5-1, 5-2, and 5-3, pp.191-199
| truth: the Anti-drugwar | ||
| Homepage | Sitemap | |
|
|
Source: Monitoring the Future (2009), Vol I, Tables 5-1, 5-2, and 5-3, pp.191-199
| Trends in Hallucinogen Use Among 12th Grade Students (1975 - 2008) | |||
|---|---|---|---|
| Year | Lifetime | Past Year | Past Month |
| 1975 | 16.3 | 11.2 | 4.7 |
| 1976 | 15.1 | 9.4 | 3.4 |
| 1977 | 13.9 | 8.8 | 4.1 |
| 1978 | 14.3 | 9.6 | 3.9 |
| 1979 | 14.1 | 9.9 | 4.0 |
| 1980 | 13.3 | 9.3 | 3.7 |
| 1981 | 13.3 | 9.0 | 3.7 |
| 1982 | 12.5 | 8.1 | 3.4 |
| 1983 | 11.9 | 7.3 | 2.8 |
| 1984 | 10.7 | 6.5 | 2.6 |
| 1985 | 10.3 | 6.3 | 2.5 |
| 1986 | 9.7 | 6.0 | 2.5 |
| 1987 | 10.3 | 6.4 | 2.5 |
| 1988 | 8.9 | 5.5 | 2.2 |
| 1989 | 9.4 | 5.6 | 2.2 |
| 1990 | 9.4 | 5.9 | 2.2 |
| 1991 | 9.6 | 5.8 | 2.2 |
| 1992 | 9.2 | 5.9 | 2.1 |
| 1993 | 10.9 | 7.4 | 2.7 |
| 1994 | 11.4 | 7.6 | 3.1 |
| 1995 | 12.7 | 9.3 | 4.4 |
| 1996 | 14.0 | 10.1 | 3.5 |
| 1997 | 15.1 | 9.8 | 3.9 |
| 1998 | 14.1 | 9.0 | 3.8 |
| 1999 | 13.7 | 9.4 | 3.5 |
| 2000 | 13.0 | 8.1 | 2.6 |
| 2001 | 14.7 | 9.1 | 3.3 |
| 2002 | 12.0 | 6.6 | 2.3 |
| 2003 | 10.6 | 5.9 | 1.8 |
| 2004 | 9.7 | 6.2 | 1.9 |
| 2005 | 8.8 | 5.5 | 1.9 |
| 2006 | 8.3 | 4.9 | 1.5 |
| 2007 | 8.4 | 5.4 | 1.7 |
| 2008 | 8.7 | 5.9 | 2.2 |
| Averages: | 11.7 | 7.6 | 2.9 |
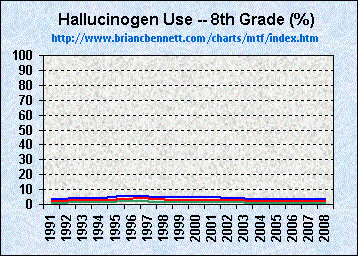
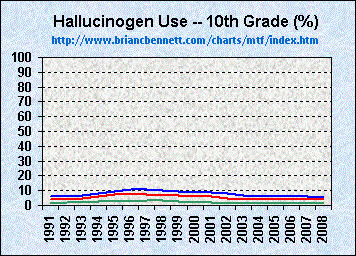
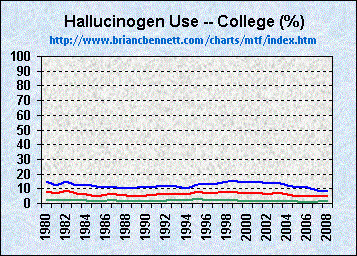
| 8th Grade Students | 10th Grade Students | College Students |
 |
 |
 |
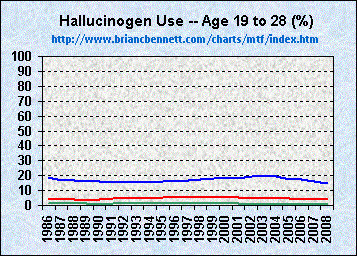
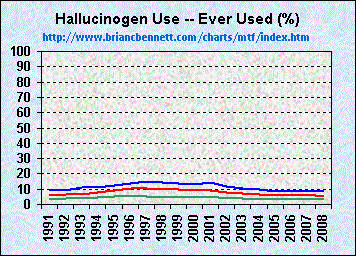
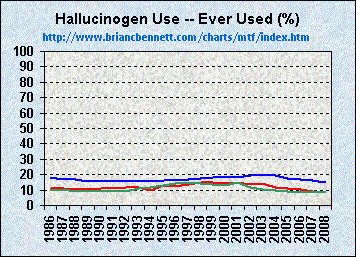
| Age 19 to 28 | Comparison of Trends Among School Age Youth | Comparison of Trends Among Young Adults |
 |
 |
 |
| truth: the Anti-drugwar | ||
| Homepage | Sitemap | |