Monitoring the Future -- Any Illicit Use
Trends Among 12th Grade Students (1975 - 2008)

Source: Monitoring the Future (2009), Vol I, Tables 5-1, 5-2, and 5-3, pp.191-199
| truth: the Anti-drugwar | ||
| Homepage | Sitemap | |
Source: Monitoring the Future (2009), Vol I, Tables 5-1, 5-2, and 5-3, pp.191-199
| Trends in Use of Any Illicit Drug Among 12th Grade Students (1975 - 2008) | |||
|---|---|---|---|
| Year | Lifetime | Past Year | Past Month |
| 1975 | 55.2 | 45.0 | 30.7 |
| 1976 | 58.3 | 48.1 | 34.2 |
| 1977 | 61.6 | 51.1 | 37.6 |
| 1978 | 64.1 | 53.8 | 38.9 |
| 1979 | 65.1 | 54.2 | 38.9 |
| 1980 | 65.4 | 53.1 | 37.2 |
| 1981 | 65.6 | 52.1 | 36.9 |
| 1982 | 64.4 | 49.4 | 32.5 |
| 1983 | 62.9 | 47.4 | 30.5 |
| 1984 | 61.6 | 45.8 | 29.2 |
| 1985 | 60.6 | 46.3 | 29.7 |
| 1986 | 57.6 | 44.3 | 27.1 |
| 1987 | 56.6 | 41.7 | 24.7 |
| 1988 | 53.9 | 38.5 | 21.3 |
| 1989 | 50.9 | 35.4 | 19.7 |
| 1990 | 47.9 | 32.5 | 17.2 |
| 1991 | 44.1 | 29.4 | 16.4 |
| 1992 | 40.7 | 27.1 | 14.4 |
| 1993 | 42.9 | 31.0 | 18.3 |
| 1994 | 45.6 | 35.8 | 21.9 |
| 1995 | 48.4 | 39.0 | 23.8 |
| 1996 | 50.8 | 40.2 | 24.6 |
| 1997 | 54.3 | 42.4 | 26.2 |
| 1998 | 54.1 | 41.4 | 25.6 |
| 1999 | 54.7 | 42.1 | 25.9 |
| 2000 | 54.0 | 40.9 | 24.9 |
| 2001 | 53.9 | 41.4 | 25.7 |
| 2002 | 53.0 | 41.0 | 25.4 |
| 2003 | 51.1 | 39.3 | 24.1 |
| 2004 | 51.1 | 38.8 | 23.4 |
| 2005 | 50.4 | 38.4 | 23.1 |
| 2006 | 48.2 | 36.5 | 21.5 |
| 2007 | 46.8 | 35.9 | 21.9 |
| 2008 | 47.4 | 36.6 | 22.3 |
| Averages: | 54.2 | 41.6 | 26.3 |
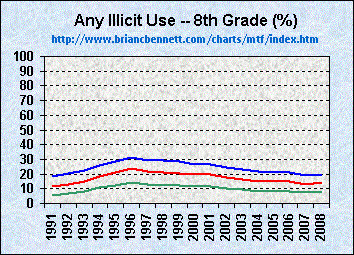
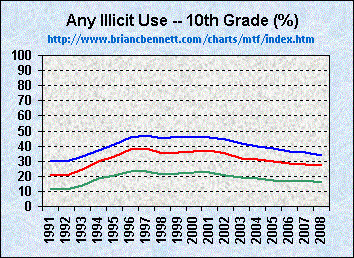
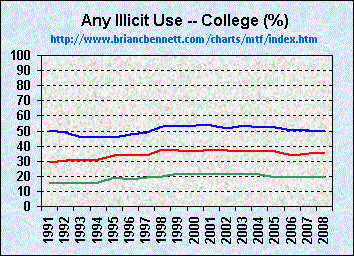
| 8th Grade Students | 10th Grade Students | College Students |
 |
 |
 |
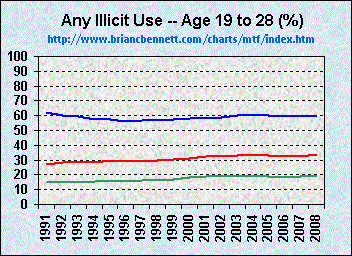
| Age 19 to 28 | Comparison of Trends Among School Age Youth | Comparison of Trends Among Young Adults |
 |
 |
 |
| truth: the Anti-drugwar | ||
| Homepage | Sitemap | |