Monitoring the Future -- Alcohol Use
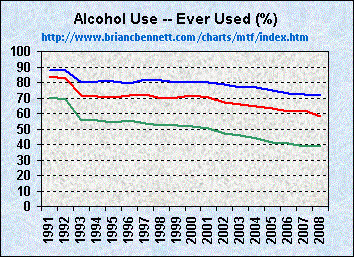
Trends Among 10th Grade Students (1991 - 2008)
Source: Monitoring the Future (2009), Vol I, Tables 5-5a, 5-5b, and 5-5c, pp.202-213
| truth: the Anti-drugwar | ||
| Homepage | Sitemap | |
Source: Monitoring the Future (2009), Vol I, Tables 5-5a, 5-5b, and 5-5c, pp.202-213
| Trends in Alcohol Use Among 10th Grade Students (1991 - 2008) | |||
|---|---|---|---|
| Year | Lifetime | Past Year | Past Month |
| 1991 | 83.8 | 72.3 | 42.8 |
| 1992 | 82.3 | 70.2 | 39.9 |
| 1993 | 71.6 | 63.4 | 38.2 |
| 1994 | 71.1 | 63.9 | 39.2 |
| 1995 | 70.5 | 63.5 | 38.8 |
| 1996 | 71.8 | 65.0 | 40.4 |
| 1997 | 72.0 | 65.2 | 40.1 |
| 1998 | 69.8 | 62.7 | 38.8 |
| 1999 | 70.6 | 63.7 | 40.0 |
| 2000 | 71.4 | 65.3 | 41.0 |
| 2001 | 70.1 | 63.5 | 39.0 |
| 2002 | 66.9 | 60.0 | 35.4 |
| 2003 | 66.0 | 59.3 | 35.4 |
| 2004 | 64.2 | 58.2 | 35.2 |
| 2005 | 63.2 | 56.7 | 33.2 |
| 2006 | 61.5 | 55.8 | 33.8 |
| 2007 | 61.7 | 56.3 | 33.4 |
| 2008 | 58.3 | 52.5 | 28.8 |
| Averages: | 69.3 | 62.1 | 37.4 |
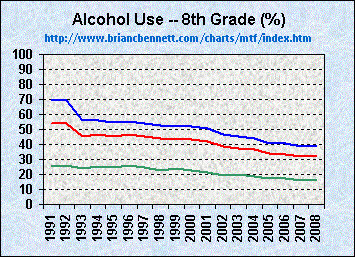
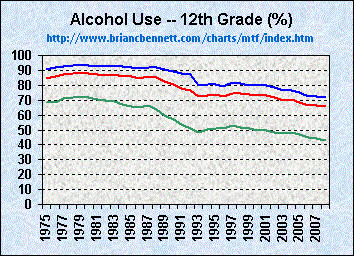
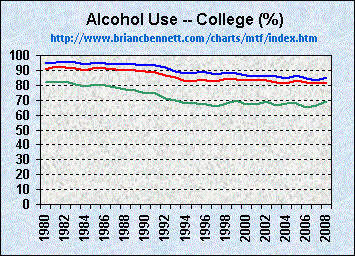
| 8th Grade Students | 12th Grade Students | College Students |
 |
 |
 |
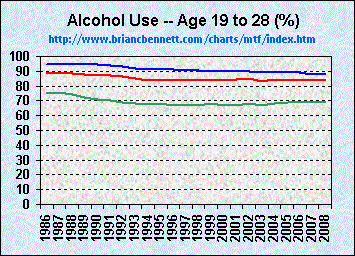
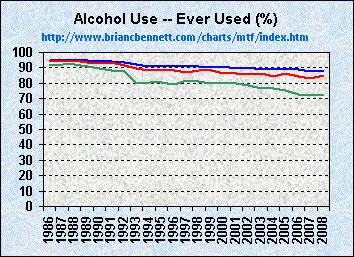
| Age 19 to 28 | Comparison of Trends Among School Age Youth | Comparison of Trends Among Young Adults |
 |
 |
 |
| truth: the Anti-drugwar | ||
| Homepage | Sitemap | |