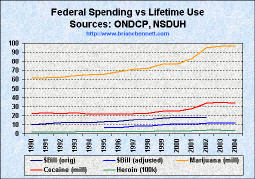
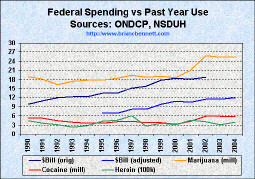
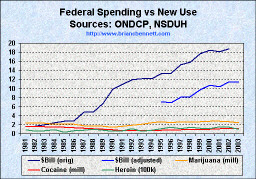
Federal Drug War Spending vs Past Month Use Rates
Sources: ONDCP National Drug Control Strategy
National Survey on Drug Use and Health
| Total Federal Drug War Budget versus Past Month Use of Marijuana Cocaine and Heroin | |||||
|---|---|---|---|---|---|
| Year | Original Budget (billions) | Adjusted Budget (billions) | Marijuana | Cocaine | Heroin |
| 1981 | 1.5 | -- | -- | -- | -- |
| 1982 | 1.7 | -- | 21,507,000 | 4,491,000 | 162,000 |
| 1983 | 2.0 | -- | -- | -- | -- |
| 1984 | 2.4 | -- | -- | -- | -- |
| 1985 | 2.8 | -- | 18,641,000 | 5,686,000 | 137,000 |
| 1986 | 2.9 | -- | -- | -- | -- |
| 1987 | 4.8 | -- | -- | -- | -- |
| 1988 | 4.7 | -- | 12,353,000 | 3,140,000 | 79,000 |
| 1989 | 6.7 | -- | -- | -- | -- |
| 1990 | 9.8 | -- | 10,913,000 | 1,720,000 | 41,000 |
| 1991 | 10.9 | -- | 10,366,000 | 2,032,000 | 71,000 |
| 1992 | 11.9 | -- | 9,676,000 | 1,402,000 | 92,000 |
| 1993 | 12.2 | -- | 9,610,000 | 1,404,000 | 68,000 |
| 1994 | 12.2 | -- | 10,112,000 | 1,382,000 | 117,000 |
| 1995 | 13.3 | 7.0 | 9,842,000 | 1,453,000 | 196,000 |
| 1996 | 13.4 | 6.8 | 10,095,000 | 1,749,000 | 216,000 |
| 1997 | 15.2 | 8.1 | 11,109,000 | 1,505,000 | 325,000 |
| 1998 | 15.8 | 8.2 | 11,016,000 | 1,750,000 | 130,000 |
| 1999 | 17.7 | 9.8 | 10,458,000 | 1,552,000 | 154,000 |
| 2000 | 18.5 | 10.7 | 10,714,000 | 1,213,000 | 130,000 |
| 2001 | 18.1 | 10.4 | 12,122,000 | 1,676,000 | 123,000 |
| 2002 | 18.8 | 11.5 | 14,584,000 | 2,020,000 | 166,000 |
| 2003 | -- | 11.4 | 14,638,000 | 2,281,000 | 119,000 |
| 2004 | -- | 11.9 | 14,576,000 | 2,021,000 | 166,000 |
| Note: The ONDCP changed their accounting practices in determining the levels of total federal drug war spending. The Drug Policy Alliance wrote a critique of the new calculation methods here. |
|
Latest complete use rates data: NSDUH (12 and older) or MTF (HS, College, Young Adult) |
| Spending versus Lifetime Use | Spending versus Past Year Use | Spending versus New Use |
 |
 |
 |
| truth: the Anti-drugwar | Anti-drugwar Arsenal | Accept the $1 Challenge |