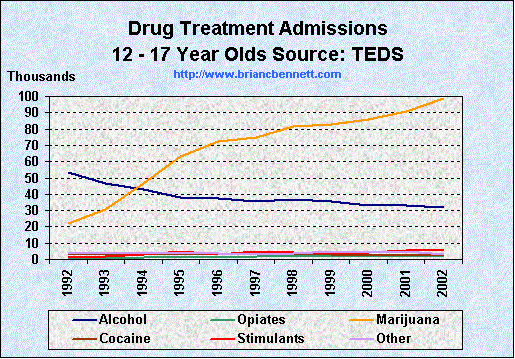
| Distribution of Drug Treatment Admissions - by Drug (12 - 17 year olds) | ||||||||
|---|---|---|---|---|---|---|---|---|
| Year | Total (12-17) | Alcohol | Opiates | Marijuana | Cocaine | Stimulants | Other Drugs | None Reported |
| 1992 | 95,017 | 53,416 | 834 | 21,899 | 3,852 | 1,390 | 4,484 | 9,142 |
| 1993 | 95,271 | 46,915 | 874 | 30,742 | 3,041 | 1,907 | 3,986 | 7,806 |
| 1994 | 109,123 | 43,065 | 1,161 | 46,572 | 3,500 | 3,166 | 3,933 | 7,726 |
| 1995 | 122,910 | 37,996 | 1,273 | 63,403 | 3,196 | 4,983 | 4,069 | 7,990 |
| 1996 | 129,859 | 37,538 | 1,440 | 72,601 | 3,286 | 3,106 | 3,427 | 8,461 |
| 1997 | 131,194 | 35,747 | 1,995 | 74,639 | 3,106 | 4,622 | 3,167 | 7,918 |
| 1998 | 139,129 | 36,566 | 2,141 | 81,650 | 3,623 | 4,400 | 3,709 | 7,031 |
| 1999 | 137,783 | 35,450 | 2,115 | 82,797 | 3,171 | 3,468 | 4,696 | 6,086 |
| 2000 | 138,660 | 33,386 | 1,992 | 85,888 | 2,636 | 4,328 | 4,578 | 5,852 |
| 2001 | 146,012 | 32,847 | 2,060 | 91,022 | 2,622 | 5,351 | 4,722 | 7,388 |
| 2002 | 156,367 | 31,921 | 2,222 | 98,499 | 2,925 | 6,182 | 3,360 | 11,258 |
Source: Treatment Episode Data Sets (2004)