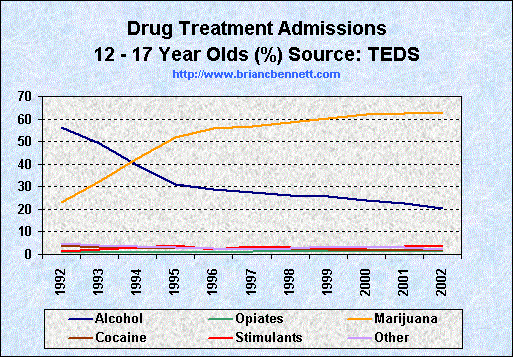
| Distribution of Drug Treatment Admissions Among 12 - 17 Year Olds (% by drug) | ||||||||
|---|---|---|---|---|---|---|---|---|
| Year | Total | Alcohol | Opiates | Marijuana | Cocaine | Stimulants | Other Drugs | None Reported |
| 1992 | 95,017 | 56.2 | 0.9 | 23.0 | 4.1 | 1.5 | 4.7 | 9.6 |
| 1993 | 95,271 | 49.2 | 0.9 | 32.3 | 3.2 | 2.0 | 4.2 | 8.2 |
| 1994 | 109,123 | 39.5 | 1.1 | 42.7 | 3.2 | 2.9 | 3.6 | 7.1 |
| 1995 | 122,910 | 30.9 | 1.0 | 51.6 | 2.6 | 4.1 | 3.3 | 6.5 |
| 1996 | 129,859 | 28.9 | 1.1 | 55.9 | 2.5 | 2.4 | 2.6 | 6.5 |
| 1997 | 131,194 | 27.2 | 1.5 | 56.9 | 2.4 | 3.5 | 2.4 | 6.0 |
| 1998 | 139,129 | 26.3 | 1.5 | 58.7 | 2.6 | 3.2 | 2.7 | 5.1 |
| 1999 | 137,783 | 25.7 | 1.5 | 60.1 | 2.3 | 2.5 | 3.4 | 4.4 |
| 2000 | 138,660 | 24.1 | 1.4 | 61.9 | 1.9 | 3.1 | 3.3 | 4.2 |
| 2001 | 146,012 | 22.5 | 1.4 | 62.3 | 1.8 | 3.7 | 3.2 | 5.1 |
| 2002 | 156,367 | 20.4 | 1.4 | 63.0 | 1.9 | 4.0 | 2.1 | 7.2 |
Source: Treatment Episode Data Sets (2004)