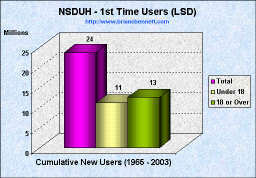
| Trends in Initiation of LSD Use (1965 - 2003) | |
|---|---|
 |
 |
 |
 |
Source: National Survey on Drug Use and Health
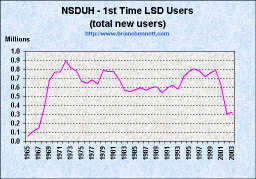
| Trends in Initiation of LSD Use (1965 - 2003) | |
|---|---|
|
|
|
|
|
|
Source: National Survey on Drug Use and Health
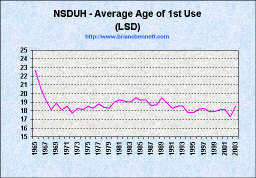
| YEAR | NUMBER OF INITIATES (1,000s) | MEAN AGE | AGE-SPECIFIC RATES1 | |||
|---|---|---|---|---|---|---|
| All Ages | Under 18 | 18 or Older | 12-17 | 18-25 | ||
| 1965 | 58 | * | 32 | 22.7 | * | 0.9 |
| 1966 | 110 | 42 | 69 | 20.6 | 2.0 | 2.6 |
| 1967 | 142 | 52 | 91 | 19.3 | 2.2 | 3.4 |
| 1968 | 366 | 209 | 157 | 18.1 | 9.6 | 5.3 |
| 1969 | 674 | 244 | 431 | 18.9 | 10.6 | 16.8 |
| 1970 | 764 | 342 | 422 | 18.1 | 15.0 | 17.1 |
| 1971 | 769 | 347 | 422 | 18.5 | 15.0 | 15.1 |
| 1972 | 897 | 460 | 437 | 17.7 | 20.0 | 16.3 |
| 1973 | 816 | 403 | 413 | 18.3 | 17.0 | 14.6 |
| 1974 | 785 | 409 | 376 | 18.1 | 17.4 | 13.4 |
| 1975 | 664 | 312 | 352 | 18.5 | 13.3 | 12.2 |
| 1976 | 643 | 284 | 360 | 18.3 | 12.2 | 12.9 |
| 1977 | 683 | 311 | 372 | 18.8 | 13.4 | 12.9 |
| 1978 | 634 | 261 | 373 | 18.4 | 11.5 | 13.0 |
| 1979 | 787 | 388 | 399 | 18.3 | 17.5 | 13.0 |
| 1980 | 772 | 359 | 414 | 19.0 | 16.7 | 12.6 |
| 1981 | 773 | 319 | 455 | 19.3 | 15.3 | 14.2 |
| 1982 | 681 | 288 | 393 | 19.1 | 13.8 | 12.4 |
| 1983 | 565 | 222 | 343 | 19.0 | 10.8 | 11.8 |
| 1984 | 549 | 196 | 353 | 19.5 | 9.7 | 11.2 |
| 1985 | 570 | 266 | 303 | 19.2 | 13.1 | 9.1 |
| 1986 | 596 | 247 | 350 | 19.2 | 12.6 | 11.5 |
| 1987 | 567 | 287 | 280 | 18.6 | 14.9 | 9.4 |
| 1988 | 597 | 254 | 343 | 18.7 | 13.5 | 11.9 |
| 1989 | 604 | 231 | 373 | 19.5 | 12.3 | 11.6 |
| 1990 | 537 | 251 | 286 | 18.9 | 13.4 | 9.8 |
| 1991 | 597 | 302 | 296 | 18.3 | 16.0 | 10.9 |
| 1992 | 620 | 284 | 336 | 18.5 | 14.7 | 12.4 |
| 1993 | 579 | 282 | 297 | 18.5 | 14.3 | 10.6 |
| 1994 | 714 | 400 | 314 | 17.8 | 19.7 | 11.8 |
| 1995 | 780 | 404 | 376 | 17.8 | 19.4 | 14.8 |
| 1996 | 805 | 413 | 392 | 18.2 | 19.3 | 15.0 |
| 1997 | 777 | 392 | 385 | 18.3 | 17.7 | 14.9 |
| 1998 | 716 | 401 | 314 | 17.9 | 17.6 | 12.1 |
| 1999 | 762 | 397 | 365 | 17.9 | 17.1 | 13.8 |
| 2000 | 788 | 392 | 396 | 18.1 | 16.6 | 14.7 |
| 2001 | 614 | 314 | 300 | 18.1 | 13.0 | 10.9 |
| 20022 | 303 | 170 | 133 | 17.3 | 6.8 | 5.0 |
| 20033 | 320 | 147 | 173 | 18.5 | 5.7 | 5.4 |
| *Low precision; no estimate reported. -- Not available. NOTE: Comparisons between years, particularly between recent estimates and those from 10 or more years prior, should be made with caution due to potential bias from reporting and other sources. 1 The numerator of each rate is the number of persons in the age group who initiated use of the drug in the specified year, while the denominator is the person-time exposure of persons in the age group measured in thousands of years. 2 Estimated using 2003 and 2004 data only. 3 Estimated using 2004 data only. Source: SAMHSA, Office of Applied Studies, National Survey on Drug Use and Health, 2002, 2003, and 2004. |
||||||
| truth: the Anti-drugwar | Anti-drugwar Arsenal | Accept the $1 Challenge |