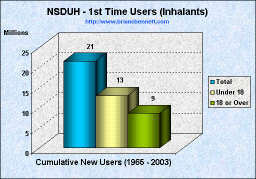
| Trends in Initiation of Inhalant Use (1965 - 2003) | |
|---|---|
 |
 |
 |
 |
Source: National Survey on Drug Use and Health
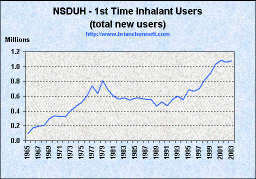
| Trends in Initiation of Inhalant Use (1965 - 2003) | |
|---|---|
|
|
|
|
|
|
Source: National Survey on Drug Use and Health
| YEAR | NUMBER OF INITIATES (1,000s) | MEAN AGE | AGE-SPECIFIC RATES1 | |||
|---|---|---|---|---|---|---|
| All Ages | Under 18 | 18 or Older | 12-17 | 18-25 | ||
| 1965 | 92 | 91 | * | 13.9 | 4.3 | * |
| 1966 | 172 | 139 | 33 | 15.4 | 5.8 | 1.4 |
| 1967 | 194 | 132 | 61 | 16.3 | 5.4 | 2.3 |
| 1968 | 209 | 146 | 63 | 17.0 | 6.2 | 1.7 |
| 1969 | 296 | 213 | 83 | 16.1 | 9.2 | 3.3 |
| 1970 | 335 | 204 | 131 | 16.4 | 7.7 | 5.2 |
| 1971 | 325 | 207 | 117 | 17.3 | 8.4 | 3.2 |
| 1972 | 326 | 220 | 106 | 16.3 | 8.6 | 3.6 |
| 1973 | 406 | 226 | 180 | 18.1 | 9.5 | 5.4 |
| 1974 | 465 | 248 | 217 | 18.3 | 9.4 | 6.0 |
| 1975 | 519 | 316 | 203 | 17.3 | 12.3 | 6.7 |
| 1976 | 599 | 302 | 298 | 18.2 | 12.7 | 9.1 |
| 1977 | 742 | 345 | 396 | 18.4 | 14.1 | 11.5 |
| 1978 | 636 | 350 | 286 | 17.9 | 14.6 | 8.6 |
| 1979 | 806 | 404 | 401 | 18.6 | 17.7 | 10.9 |
| 1980 | 678 | 379 | 299 | 18.5 | 17.5 | 8.3 |
| 1981 | 597 | 329 | 268 | 18.1 | 15.1 | 7.2 |
| 1982 | 562 | 282 | 280 | 18.8 | 12.4 | 6.9 |
| 1983 | 579 | 325 | 254 | 18.1 | 14.3 | 6.6 |
| 1984 | 547 | 307 | 240 | 18.1 | 14.7 | 6.9 |
| 1985 | 573 | 276 | 297 | 19.0 | 13.6 | 8.6 |
| 1986 | 573 | 338 | 235 | 18.9 | 16.6 | 6.0 |
| 1987 | 560 | 315 | 244 | 18.1 | 15.1 | 7.7 |
| 1988 | 551 | 323 | 228 | 17.5 | 15.9 | 7.4 |
| 1989 | 464 | 239 | 225 | 18.0 | 11.4 | 7.8 |
| 1990 | 523 | 287 | 236 | 17.9 | 14.4 | 8.3 |
| 1991 | 472 | 268 | 204 | 18.5 | 13.3 | 5.6 |
| 1992 | 559 | 359 | 200 | 16.9 | 17.4 | 7.2 |
| 1993 | 597 | 338 | 259 | 18.1 | 16.1 | 7.8 |
| 1994 | 551 | 373 | 178 | 16.7 | 16.6 | 6.3 |
| 1995 | 689 | 404 | 285 | 17.6 | 17.7 | 10.3 |
| 1996 | 670 | 408 | 262 | 17.0 | 16.5 | 9.3 |
| 1997 | 704 | 455 | 248 | 16.4 | 17.5 | 9.7 |
| 1998 | 821 | 507 | 314 | 17.2 | 18.4 | 11.1 |
| 1999 | 904 | 572 | 332 | 16.6 | 20.2 | 11.5 |
| 2000 | 1,028 | 708 | 320 | 16.4 | 24.8 | 10.6 |
| 2001 | 1,085 | 759 | 325 | 16.0 | 27.9 | 11.5 |
| 20022 | 1,057 | 812 | 245 | 15.4 | 29.6 | 8.4 |
| 20033 | 1,077 | 829 | 248 | 15.4 | 31.9 | 8.4 |
| *Low precision; no estimate reported. -- Not available. NOTE: Comparisons between years, particularly between recent estimates and those from 10 or more years prior, should be made with caution due to potential bias from reporting and other sources. 1 The numerator of each rate is the number of persons in the age group who initiated use of the drug in the specified year, while the denominator is the person-time exposure of persons in the age group measured in thousands of years. 2 Estimated using 2003 and 2004 data only. 3 Estimated using 2004 data only. Source: SAMHSA, Office of Applied Studies, National Survey on Drug Use and Health, 2002, 2003, and 2004. |
||||||
| truth: the Anti-drugwar | Anti-drugwar Arsenal | Accept the $1 Challenge |