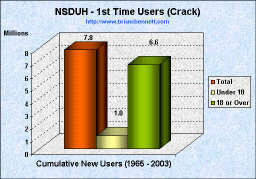
| Trends in Initiation of Crack Use (1965 - 2003) | |
|---|---|
 |
 |
 |
 |
Source: National Survey on Drug Use and Health
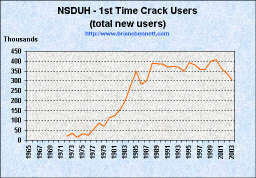
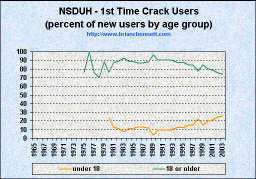
| Trends in Initiation of Crack Use (1965 - 2003) | |
|---|---|
|
|
|
|
|
|
Source: National Survey on Drug Use and Health
| YEAR | NUMBER OF INITIATES (1,000s) | MEAN AGE | AGE-SPECIFIC RATES1 | |||
|---|---|---|---|---|---|---|
| All Ages | Under 18 | 18 or Older | 12-17 | 18-25 | ||
| 1965 | * | * | * | * | * | * |
| 1966 | * | * | * | * | * | * |
| 1967 | * | * | * | * | * | * |
| 1968 | * | * | * | * | * | * |
| 1969 | 15 | * | * | * | * | * |
| 1970 | * | * | * | * | * | * |
| 1971 | * | * | * | * | * | * |
| 1972 | 20 | * | * | * | * | * |
| 1973 | 36 | * | * | * | * | * |
| 1974 | 16 | * | * | * | * | * |
| 1975 | 34 | * | 26 | 20.7 | * | 0.6 |
| 1976 | 26 | * | 26 | * | * | * |
| 1977 | 54 | * | 41 | 19.3 | * | 1.2 |
| 1978 | 86 | * | 60 | 20.7 | * | 1.4 |
| 1979 | 70 | * | 62 | 22.1 | * | 1.6 |
| 1980 | 115 | 27 | 88 | 22.8 | 1.2 | 1.8 |
| 1981 | 125 | 16 | 109 | 22.8 | 0.7 | 2.6 |
| 1982 | 157 | 17 | 140 | 25.8 | 0.8 | 2.1 |
| 1983 | 200 | 15 | 185 | 24.4 | 0.7 | 3.6 |
| 1984 | 278 | 30 | 248 | 24.1 | 1.5 | 3.9 |
| 1985 | 350 | 41 | 309 | 24.7 | 2.0 | 6.0 |
| 1986 | 284 | 37 | 247 | 25.2 | 1.9 | 4.6 |
| 1987 | 302 | 39 | 263 | 23.7 | 2.0 | 5.4 |
| 1988 | 390 | 45 | 344 | 25.8 | 2.3 | 5.4 |
| 1989 | 388 | 13 | 375 | 25.1 | 0.7 | 7.3 |
| 1990 | 384 | 38 | 346 | 26.6 | 2.0 | 4.9 |
| 1991 | 370 | 35 | 334 | 26.0 | 1.7 | 5.8 |
| 1992 | 373 | 35 | 338 | 27.5 | 1.8 | 4.8 |
| 1993 | 369 | 39 | 330 | 28.1 | 1.9 | 4.8 |
| 1994 | 349 | 45 | 304 | 27.2 | 2.1 | 3.8 |
| 1995 | 393 | 48 | 345 | 27.4 | 2.2 | 5.9 |
| 1996 | 382 | 57 | 325 | 26.5 | 2.5 | 5.2 |
| 1997 | 357 | 55 | 301 | 26.2 | 2.5 | 5.4 |
| 1998 | 360 | 82 | 278 | 23.9 | 3.5 | 6.0 |
| 1999 | 399 | 61 | 338 | 27.1 | 2.5 | 5.6 |
| 2000 | 407 | 79 | 328 | 27.1 | 3.2 | 5.4 |
| 2001 | 365 | 78 | 287 | 25.3 | 3.1 | 5.3 |
| 20022 | 340 | 82 | 258 | 23.5 | 3.3 | 5.2 |
| 20033 | 303 | 79 | 225 | 23.1 | 3.1 | 4.5 |
| *Low precision; no estimate reported. -- Not available. NOTE: Comparisons between years, particularly between recent estimates and those from 10 or more years prior, should be made with caution due to potential bias from reporting and other sources. 1 The numerator of each rate is the number of persons in the age group who initiated use of the drug in the specified year, while the denominator is the person-time exposure of persons in the age group measured in thousands of years. 2 Estimated using 2003 and 2004 data only. 3 Estimated using 2004 data only. Source: SAMHSA, Office of Applied Studies, National Survey on Drug Use and Health, 2002, 2003, and 2004. |
||||||
| truth: the Anti-drugwar | Anti-drugwar Arsenal | Accept the $1 Challenge |