Click graphics to navigate
| Amphetamine Use Within Cohort -- High School Senior Classes of 1995 through 2008 | ||
|---|---|---|
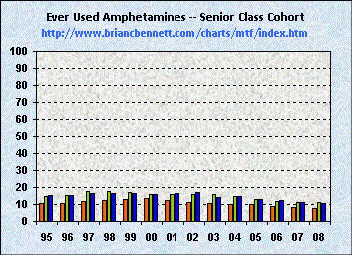
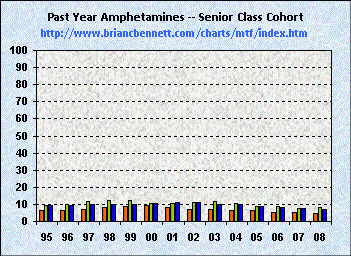
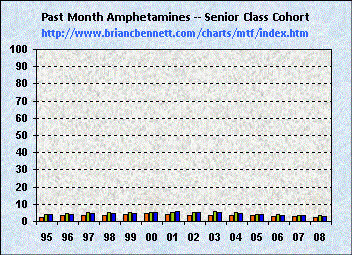
| Lifetime | Past Year | Past Month |
 |
 |
 |
Source: Monitoring the Future, 2009, Tables 5-5a, 5-5b and 5-5c, pp.202-13
| Trends in Amphetamine Use Within HS Senior Cohorts -- Classes of 1995 through 2008 | |||||||||
|---|---|---|---|---|---|---|---|---|---|
| Lifetime | Past Year | Past Month | |||||||
| Class of: | 8th Grade | 10th Grade | 12th Grade | 8th Grade | 10th Grade | 12th Grade | 8th Grade | 10th Grade | 12th Grade |
| 1995 | 10.5 | 14.9 | 15.3 | 6.2 | 9.6 | 9.3 | 2.6 | 4.3 | 4.0 |
| 1996 | 10.8 | 15.1 | 15.3 | 6.5 | 10.2 | 9.5 | 3.3 | 4.5 | 4.1 |
| 1997 | 11.8 | 17.4 | 16.5 | 7.2 | 11.9 | 10.2 | 3.6 | 5.3 | 4.8 |
| 1998 | 12.3 | 17.7 | 16.4 | 7.9 | 12.4 | 10.1 | 3.6 | 5.5 | 4.6 |
| 1999 | 13.1 | 17.0 | 16.3 | 8.7 | 12.1 | 10.2 | 4.2 | 5.1 | 4.5 |
| 2000 | 13.5 | 16.0 | 15.6 | 9.1 | 10.7 | 10.5 | 4.6 | 5.1 | 5.0 |
| 2001 | 12.3 | 15.7 | 16.2 | 8.1 | 10.4 | 10.9 | 3.8 | 5.0 | 5.6 |
| 2002 | 11.3 | 15.7 | 16.8 | 7.2 | 11.1 | 11.1 | 3.3 | 5.4 | 5.5 |
| 2003 | 10.7 | 16.0 | 14.4 | 6.9 | 11.7 | 9.9 | 3.4 | 5.6 | 5.0 |
| 2004 | 9.9 | 14.9 | 15.0 | 6.5 | 10.7 | 10.0 | 3.4 | 5.2 | 4.6 |
| 2005 | 10.2 | 13.1 | 13.1 | 6.7 | 9.0 | 8.6 | 3.2 | 4.3 | 3.9 |
| 2006 | 8.7 | 11.9 | 12.4 | 5.5 | 8.5 | 8.1 | 2.8 | 4.0 | 3.7 |
| 2007 | 8.4 | 11.1 | 11.4 | 5.5 | 7.8 | 7.5 | 2.7 | 3.7 | 3.7 |
| 2008 | 7.5 | 11.2 | 10.5 | 4.9 | 7.9 | 6.8 | 2.3 | 3.5 | 2.9 |