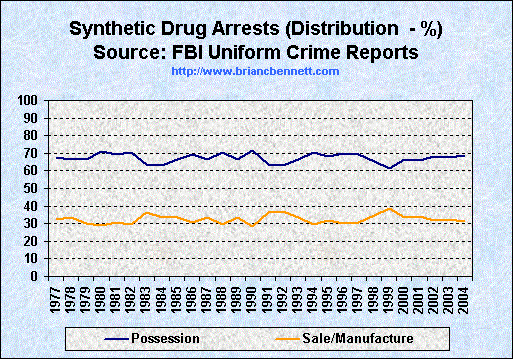
Synthetic Drug Arrests (1977 - 2004)
by Offense Type

Source: FBI Uniform Crime Reports
| Synthetic Drug Arrests: Number and Distribution of Arrests (1977 - 2004) | ||||||
|---|---|---|---|---|---|---|
| Possession Arrests | Sales/Manufacture Arrests | |||||
| Year | Synthetic Drug Arrests | % of Drug Law Arrests | Number | % of Syn. Drug Arrests | Number | % of Syn. Drug Arrests |
| 1977 | 17,996 | 2.8 | 12,211 | 67.9 | 5,784 | 32.1 |
| 1978 | 16,975 | 2.7 | 11,317 | 66.7 | 5,658 | 33.3 |
| 1979 | 18,434 | 3.3 | 12,289 | 66.7 | 5,586 | 30.3 |
| 1980 | 22,074 | 3.8 | 15,684 | 71.1 | 6,390 | 28.9 |
| 1981 | 20,156 | 3.6 | 13,998 | 69.4 | 6,159 | 30.6 |
| 1982 | 25,012 | 3.7 | 17,576 | 70.3 | 7,436 | 29.7 |
| 1983 | 21,826 | 3.3 | 13,889 | 63.6 | 7,937 | 36.4 |
| 1984 | 19,127 | 2.7 | 12,043 | 63.0 | 6,376 | 33.3 |
| 1985 | 19,474 | 2.4 | 12,982 | 66.7 | 6,491 | 33.3 |
| 1986 | 21,427 | 2.6 | 14,834 | 69.2 | 6,593 | 30.8 |
| 1987 | 25,310 | 2.7 | 16,873 | 66.7 | 8,437 | 33.3 |
| 1988 | 31,190 | 2.7 | 21,949 | 70.4 | 9,242 | 29.6 |
| 1989 | 28,596 | 2.1 | 19,064 | 66.7 | 9,532 | 33.3 |
| 1990 | 22,880 | 2.1 | 16,343 | 71.4 | 6,537 | 28.6 |
| 1991 | 22,220 | 2.2 | 14,140 | 63.6 | 8,080 | 36.4 |
| 1992 | 20,262 | 1.9 | 12,797 | 63.2 | 7,465 | 36.8 |
| 1993 | 20,273 | 1.8 | 13,516 | 66.7 | 6,758 | 33.3 |
| 1994 | 22,974 | 1.7 | 16,217 | 70.6 | 6,757 | 29.4 |
| 1995 | 32,474 | 2.2 | 22,142 | 68.2 | 10,333 | 31.8 |
| 1996 | 30,124 | 2.0 | 21,087 | 70.0 | 9,037 | 30.0 |
| 1997 | 41,174 | 2.6 | 28,505 | 69.2 | 12,669 | 30.8 |
| 1998 | 45,214 | 2.9 | 29,623 | 65.5 | 15,591 | 34.5 |
| 1999 | 48,270 | 3.1 | 29,585 | 61.3 | 18,685 | 38.7 |
| 2000 | 52,126 | 3.3 | 34,750 | 66.7 | 17,375 | 33.3 |
| 2001 | 65,063 | 4.1 | 42,846 | 65.9 | 22,217 | 34.1 |
| 2002 | 67,708 | 4.4 | 46,164 | 68.2 | 21,543 | 31.8 |
| 2003 | 77,197 | 4.6 | 52,024 | 67.4 | 25,173 | 32.6 |
| 2004 | 89,031 | 5.1 | 61,100 | 68.6 | 27,931 | 31.4 |
| Grand Totals: | 944,585 | 3.0 | 635,547 | 67.3 | 307,771 | 32.6 |
Note: Possession vs sales distribution data not available before 1977