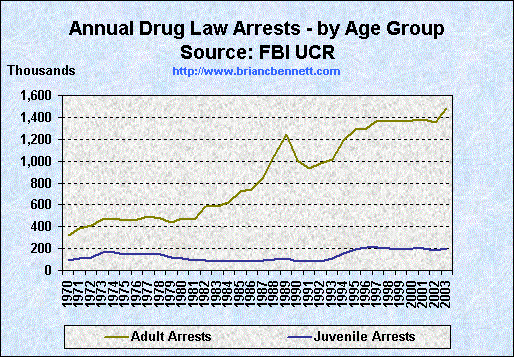
Source: FBI Uniform Crime Reports
| Trends and Distribution of Drug Law Arrests (1970 to 2003) | ||||||
|---|---|---|---|---|---|---|
| Drug Law Arrests | Adult Arrests | Juvenile Arrests | ||||
| Year | Number | % of All Arrests | Number | % of Drug Law | Number | % of Drug Law |
| 1970 | 415,600 | 5 | 322,300 | 78 | 93,300 | 22 |
| 1971 | 492,000 | 6 | 383,900 | 78 | 108,100 | 22 |
| 1972 | 527,400 | 6 | 407,300 | 77 | 120,100 | 23 |
| 1973 | 628,900 | 7 | 463,600 | 74 | 165,300 | 26 |
| 1974 | 642,100 | 7 | 474,900 | 74 | 167,200 | 26 |
| 1975 | 601,400 | 6 | 456,000 | 76 | 145,400 | 24 |
| 1976 | 609,500 | 6 | 464,100 | 76 | 145,400 | 24 |
| 1977 | 642,700 | 6 | 493,300 | 77 | 149,400 | 23 |
| 1978 | 628,700 | 6 | 480,000 | 76 | 148,700 | 24 |
| 1979 | 558,600 | 5 | 435,600 | 78 | 123,000 | 22 |
| 1980 | 580,900 | 6 | 471,200 | 81 | 109,700 | 19 |
| 1981 | 559,900 | 5 | 468,100 | 84 | 91,800 | 16 |
| 1982 | 676,000 | 6 | 584,900 | 87 | 91,200 | 13 |
| 1983 | 661,400 | 6 | 583,500 | 88 | 77,900 | 12 |
| 1984 | 708,400 | 6 | 623,700 | 88 | 84,700 | 12 |
| 1985 | 811,400 | 7 | 718,600 | 89 | 92,800 | 11 |
| 1986 | 824,100 | 7 | 742,700 | 90 | 81,400 | 10 |
| 1987 | 937,400 | 7 | 849,500 | 91 | 87,900 | 9 |
| 1988 | 1,155,200 | 8 | 1,050,600 | 91 | 104,600 | 9 |
| 1989 | 1,361,700 | 9 | 1,247,800 | 92 | 113,900 | 8 |
| 1990 | 1,089,500 | 8 | 1,008,300 | 93 | 81,200 | 7 |
| 1991 | 1,010,000 | 7 | 931,900 | 92 | 78,100 | 8 |
| 1992 | 1,066,400 | 8 | 980,700 | 92 | 85,700 | 8 |
| 1993 | 1,126,300 | 8 | 1,017,800 | 90 | 108,500 | 10 |
| 1994 | 1,351,400 | 9 | 1,192,800 | 88 | 158,600 | 12 |
| 1995 | 1,476,100 | 10 | 1,285,700 | 87 | 190,400 | 13 |
| 1996 | 1,506,200 | 10 | 1,295,100 | 86 | 211,100 | 14 |
| 1997 | 1,583,600 | 10 | 1,370,400 | 87 | 213,200 | 13 |
| 1998 | 1,559,100 | 11 | 1,360,600 | 87 | 198,500 | 13 |
| 1999 | 1,557,100 | 11 | 1,365,100 | 88 | 192,000 | 12 |
| 2000 | 1,579,566 | 11 | 1,375,600 | 87 | 203,900 | 13 |
| 2001 | 1,586,902 | 12 | 1,383,778 | 87 | 203,124 | 13 |
| 2002 | 1,538,813 | 11 | 1,352,617 | 88 | 186,196 | 12 |
| 2003 | 1,678,192 | 12 | 1,478,487 | 88 | 199,705 | 12 |
| Grand totals: | 33,732,473 | 8 | 29,120,482 | 86 | 4,612,025 | 14 |