| truth: the Anti-drugwar | ||
| Homepage | Sitemap | |
|
|
|
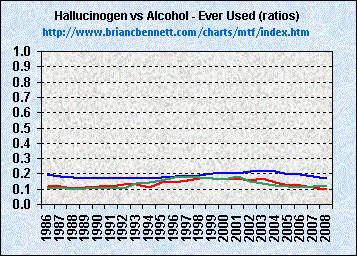
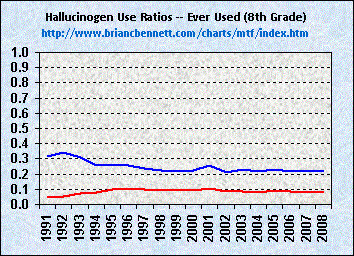
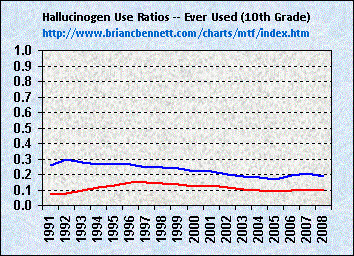
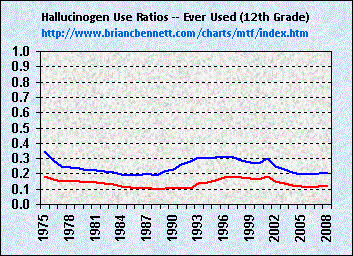
| Ratios of Hallucinogen Use to Alcohol Use Among High School Students -- Lifetime Use (1991 - 2008) | |||
|---|---|---|---|
| Year | 12th Grade | 10th Grade | 8th Grade |
| 1991 | 0.11 | 0.07 | 0.05 |
| 1992 | 6.40 | 7.50 | 9.50 |
| 1993 | 7.40 | 8.40 | 11.00 |
| 1994 | 8.20 | 9.10 | 11.70 |
| 1995 | 8.40 | 9.60 | 12.80 |
| 1996 | 8.50 | 9.50 | 12.20 |
| 1997 | 7.30 | 8.70 | 11.80 |
| 1998 | 7.10 | 8.00 | 11.10 |
| 1999 | 6.00 | 7.20 | 10.30 |
| 2000 | 6.20 | 7.30 | 9.40 |
| 2001 | 4.90 | 6.60 | 9.10 |
| 2002 | 4.90 | 5.80 | 7.70 |
| 2003 | 4.50 | 5.40 | 8.70 |
| 2004 | 4.60 | 5.90 | 9.60 |
| 2005 | 5.40 | 6.00 | 9.50 |
| 2006 | 4.70 | 6.50 | 9.10 |
| 2007 | 4.10 | 6.60 | 8.30 |
| 2008 | 4.00 | 5.90 | 8.90 |
Other Available Trend and Comparison Data
Click graphics to navigate
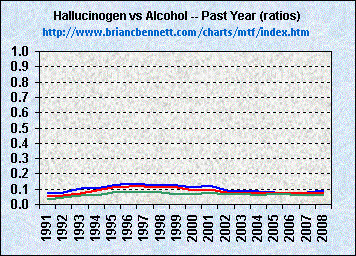
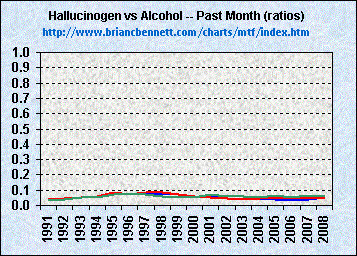
| Ratios of Hallucinogen Use vs Alcohol Use Across High School Demographics | ||
| Past Year Hallucinogen Use vs Alcohol | Past Month Hallucinogen Use vs Alcohol | Comparisons Across Young Adult Demographics |
 |
 |
 |
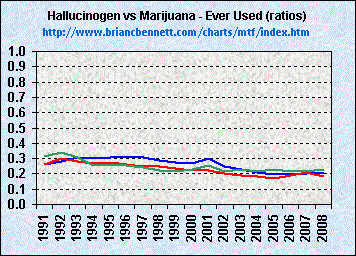
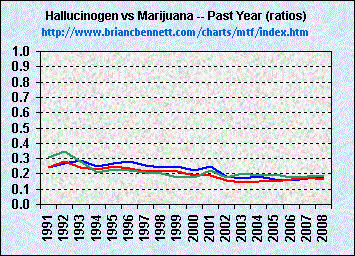
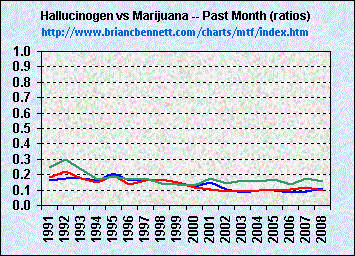
| Ratios of Hallucinogen Use vs Marijuana Use Across High School Demographics | ||
| Lifetime Hallucinogen Use vs Marijuana | Past Year Hallucinogen Use vs Marijuana | Past Month Hallucinogen Use vs Marijuana |
 |
 |
 |
| Comparison Trends by Specific High School Demographics | ||
| 8th Grade Students | 10th Grade Students | 12th Grade Students |
 |
 |
 |
| truth: the Anti-drugwar | ||
| Homepage | Sitemap | |