
|
Source: Monitoring the Future, Vol I (2009), Table 5-5b, pp. 202-204
| Trends in Alcohol Use Among High School Students -- Lifetime Use (1991 - 2008) | |||
|---|---|---|---|
| Year | 12th Grade | 10th Grade | 8th Grade |
| 1991 | 88.0 | 83.8 | 70.1 |
| 1992 | 87.5 | 82.3 | 69.3 |
| 1993 | 80.0 | 71.6 | 55.7 |
| 1994 | 80.4 | 71.1 | 55.8 |
| 1995 | 80.7 | 70.5 | 54.5 |
| 1996 | 79.2 | 71.8 | 55.3 |
| 1997 | 81.7 | 72.0 | 53.8 |
| 1998 | 81.4 | 69.8 | 52.5 |
| 1999 | 80.0 | 70.6 | 52.1 |
| 2000 | 80.3 | 71.4 | 51.7 |
| 2001 | 79.7 | 70.1 | 50.5 |
| 2002 | 78.4 | 66.9 | 47.0 |
| 2003 | 76.6 | 66.0 | 45.6 |
| 2004 | 76.8 | 64.2 | 43.9 |
| 2005 | 75.1 | 63.2 | 41.0 |
| 2006 | 72.7 | 61.5 | 40.5 |
| 2007 | 72.2 | 61.7 | 38.9 |
| 2008 | 71.9 | 58.3 | 38.9 |
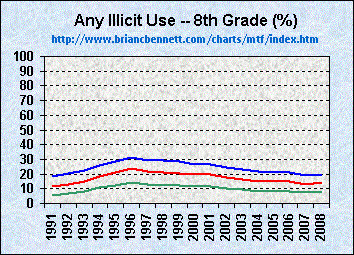
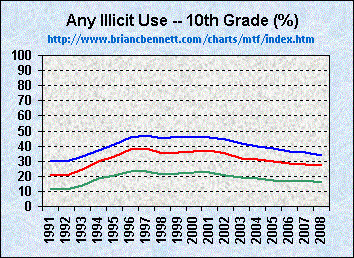
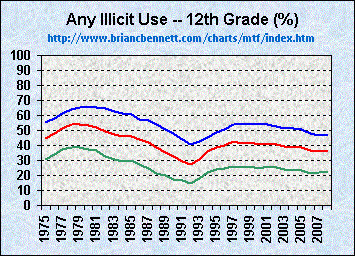
Drug Use Trends for Each Demographic Group
Click graphics to navigate
| 8th Grade Students | 10th Grade Students | 12th Grade Students |
 |
 |
 |